Chameleon
- View the Chameleon Theme Gallery
- View the Dashboard Widget Gallery
| Learn how to create Chameleon Dashboards in minutes! | ||||||||||||||||||||
|---|---|---|---|---|---|---|---|---|---|---|---|---|---|---|---|---|---|---|---|---|
This tutorial will walk you through creating two different Chameleon dashboards.
Dashboards appear on the Client Home Page
|
||||||||||||||||||||
1) Log into your system (note: we highly recommend practicing dashboards on STAGING first, since dashboards immediately become live on your client's HOME PAGE)
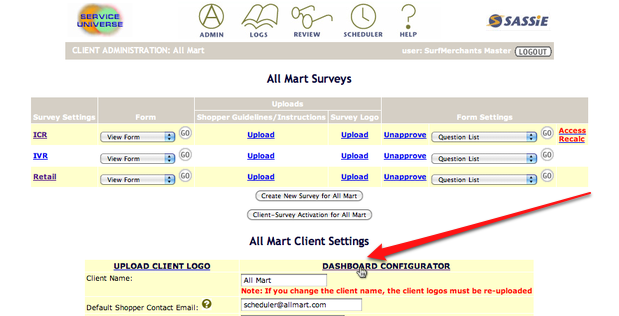
2) Go to the Client and Forms page for your selected client * select Dashboard Configurator
|
||||||||||||||||||||
Note: if your client has a custom skin, you'll see a warning here. Custom client skins need to be upgraded to for dashboard compatibility (it's a short and inexpensive customization project)
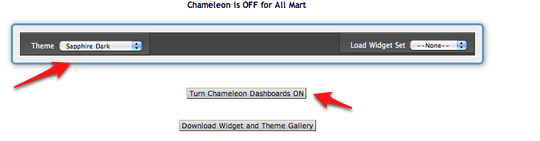
3) Select a theme (don't worry, you can change it later) 4) Select "Turn Chameleon Dashboards ON"
|
||||||||||||||||||||
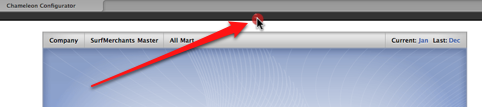
5)You'll see a blank dashboard (this is the blank dashboard for the Sapphire Dark theme). Click on the Configurator bar to open up the Configurator Drawer.
|
||||||||||||||||||||
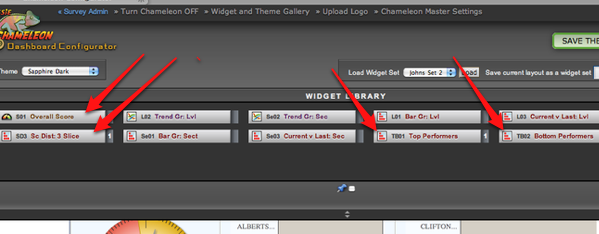
6) Drag the following 5 widgets from the Configuration Drawer onto the Dashboard:
* 2 copies of the Overall Score widget (S01) * Score Distribution: 3 slice (S03) * Top Performers (TB1) * Bottom Performers (TB2)
|
||||||||||||||||||||
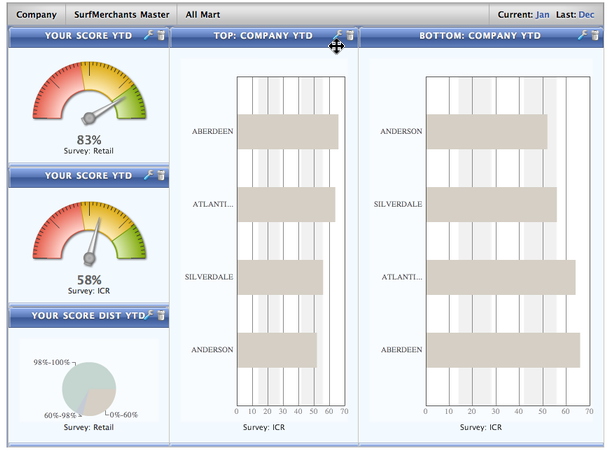
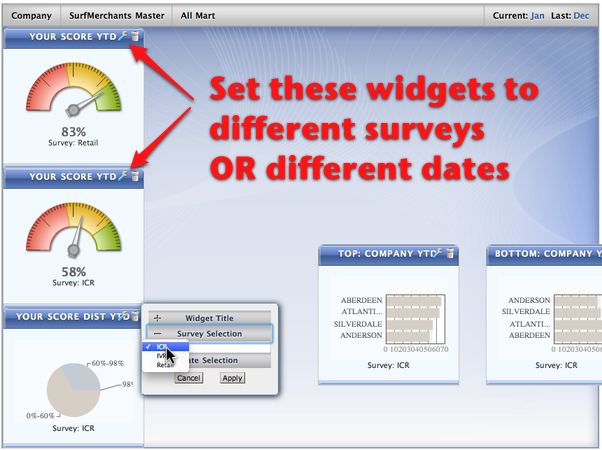
7) Resize and position the Overall Score widgets and the 3-Slice Score Distribution widget as shown below
8) Click on the wrench icons to edit the widget setting If your client has multiple surveys, set the Overall Score widgets to different surveys. If not, then set them to different date ranges 9) Set the 3-Slice Score Distribution widget to your client's most important survey
|
||||||||||||||||||||
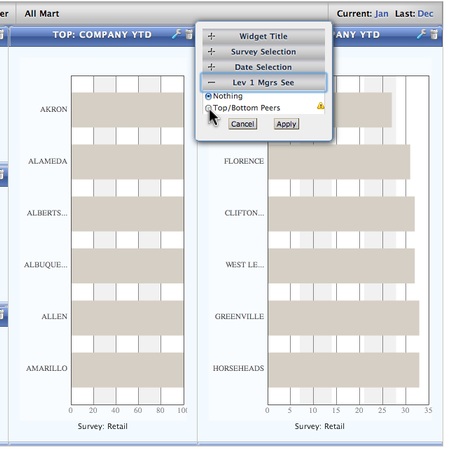
10) Resize the Top & Bottom Performer widgets as shown below
11) Upper level managers will see the top and bottom scoring location in their subdivision (i.e. CEO's see the top/bottom locations in the entire company, Division Mgrs see the top/bottom locations in their division). Decide what your client's LOCATION managers should see in this widget (they can either see "Nothing" or the "Top/Bottom Peers", the Top and Bottom scoring locations in their subdivision (i.e. District, Region, etc)
|
||||||||||||||||||||
12) Save the current settings by opening the Configuration Drawer and clicking "SAVE".
NOTE: At this point the dashboard will be visible on the Client's Home Page
|
||||||||||||||||||||
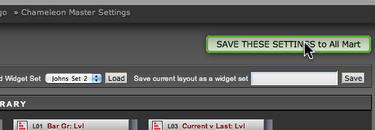
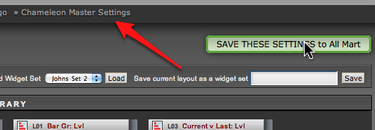
13) What if your client wants to see more or fewer locations in this widget?That's a MASTER SETTING that gets modified as follows:
Click the Chameleon Master Settings link
|
||||||||||||||||||||
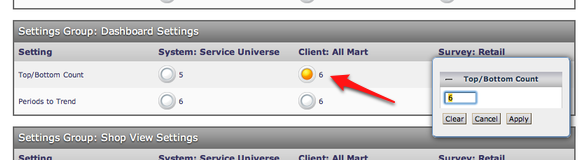
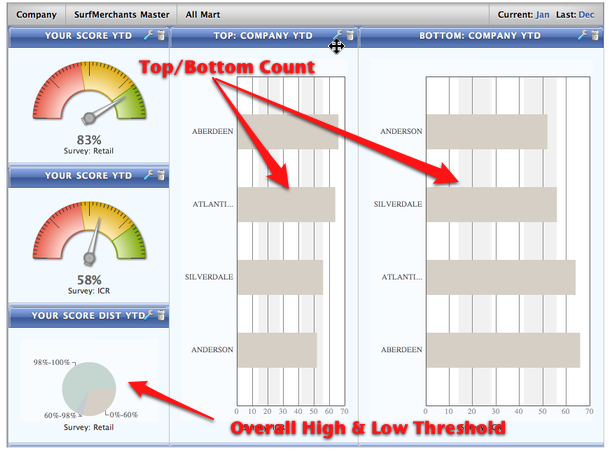
14) On the Chameleon Master Settings page, scroll down to the TOP/BOTTOM COUNT setting and click the button under the CLIENT column (if you want to set a default for your ENTIRE system, click the button under the SYSTEM column). Set this value to the desired number of locations the client would like to see in the Top & Bottom Performers widgets.
Note: This also limits the number of members shown in the Level widgets (we'll show those later).
|
||||||||||||||||||||
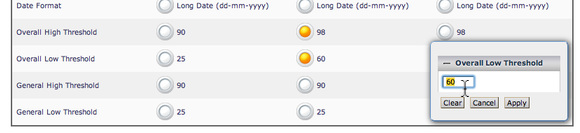
15) While we're in the Master Settings page, let's also change the score ranges for the 3-Slice Score Distribution widget.
Change the Overall High and Low Threshold values to set the breakpoints for the score ranges. Save the settings (bottom of Master Settings page) and return to the Dashboard page.
|
||||||||||||||||||||
16. Here's where you'll see the changes you just made!
|
||||||||||||||||||||
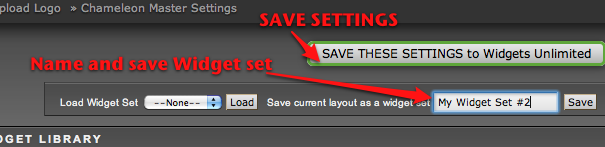
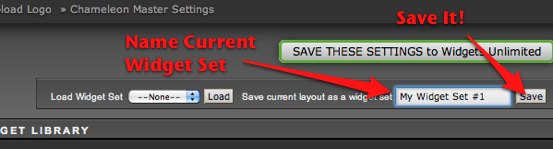
17) Want to save this layout for the future? In the Configurator Drawer, save it as a "Widget Set" that you can load up at any time.
|
||||||||||||||||||||
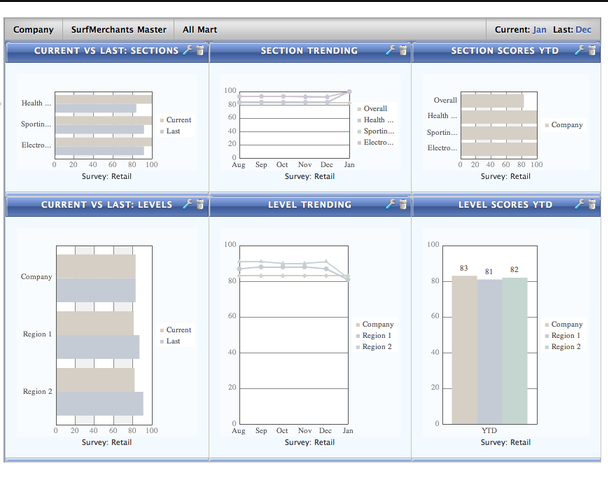
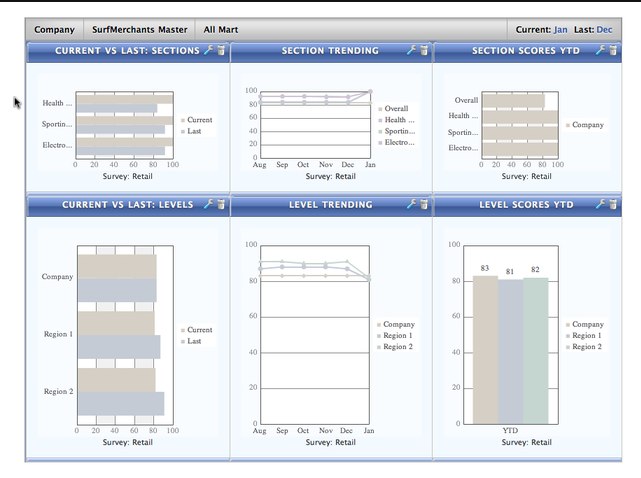
18) Lets try out another Dashboard, using the other 6 widgets. Delete the 5 current widgets and drop these 6 widgets onto the dashboard: * Trend Graph, Bar Graph and Current vs. Last for LEVELS (L01,L02, L03) * Trend Graph, Bar Graph and Current vs. Last for SECTIONS (Se01,Se02, Se03) 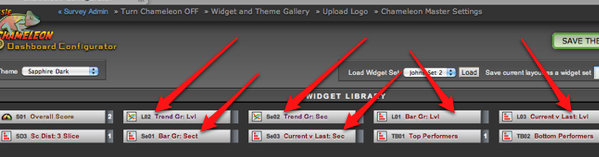 |
||||||||||||||||||||
19) Resize and position the widgets as displayed here:
|
||||||||||||||||||||
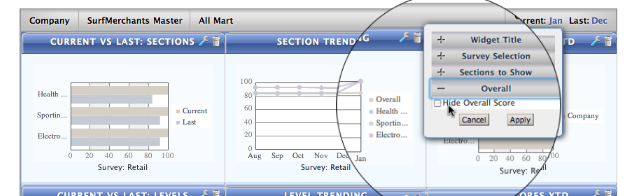
20) Edit the settings for the 3 SECTION widgets (Survey, Show Major/Minor Sections). For the Trending and Bar Graph widgets, decide to show or hide the Overall Score
|
||||||||||||||||||||
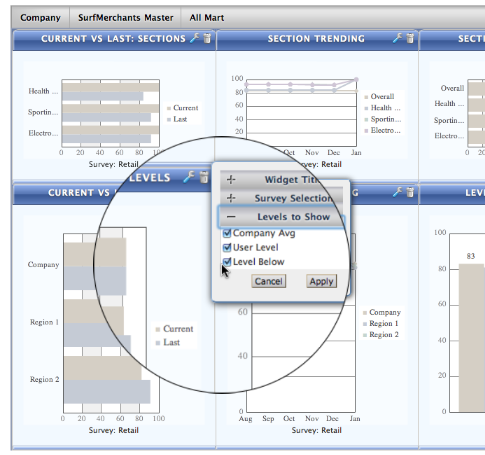
21) Edit the settings for the 3 LEVEL widgets. The trickiest setting to understand is the "Levels to Show" settings.
Here's an summary of how these settings change what's displayed to each manager type:
Warning: Don't check the "Company Avg" checkbox unless you're sure that this company is comfortable with everyone in the company knowing this information.
|
||||||||||||||||||||
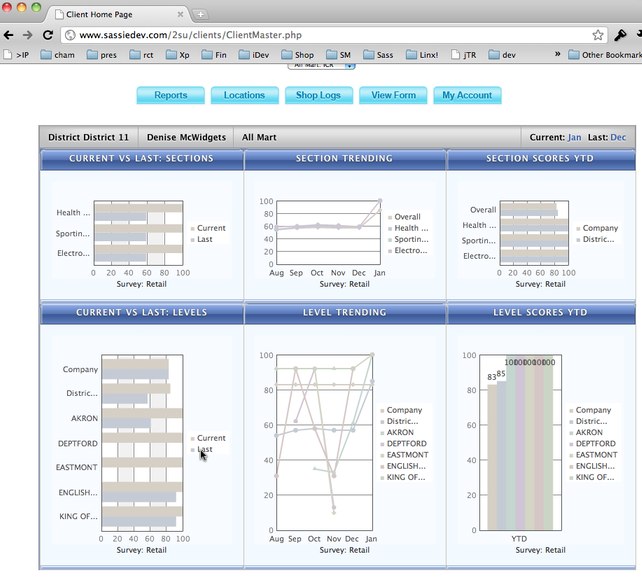
22) We HIGHLY recommend previewing how the LEVEL widgets look to managers at each level since they can look radically different to managers at different levels.
The "CEO-level" view is already displayed in the Chameleon Designer page. In this example, we've logged in as a district manager in a second browser (Firefox) and as a location manager in a third browser (Google Chrome) and navigated to the CLIENT HOME PAGE to view the dashboards. Now, every time we change a dashboard settings and do a SAVE (in the Configurator drawer), we can immediately view how the changes look to the various managers by reloading the Client Home Page. Here's what our example looks like to a DISTRICT MANAGER: (note: If there are too many locations showing up for ANY manager, you can limit the number by adjusting the Top/Bottom Count Master Setting (see Step 14). If you set it to "6", the dashboards will just show the top 3 and bottom 3 locations in that district (also, the top 3/bottom 3 districts for the region manager view, top 3/bottom3 regions for the CEO view, etc ...)
|
||||||||||||||||||||
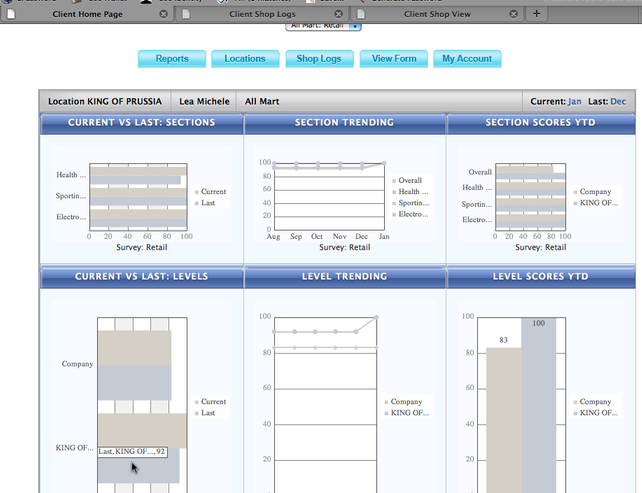
And here's what it looks like to a Location Manager:
|
||||||||||||||||||||
23) SAVE THESE SETTINGS ... and if you'd like to save this second layout as another
|
||||||||||||||||||||
24) Last Thing to know: What's considered the "Current Period"?
*.png) Will these dashboards go completely blank on the first of the month (when no shops have been done?) Of course not! Our system looks for the period with the most recent shop and sets that as the "Current Period". This way, the dashboards won't flip over to the next period until shops have been done in that period. But wait! What if that client has multiple surveys? Would a Feb shop for the IVR survey flip a Dashboard that should only be showing Jan shops for the Retail survey? Our system looks ONLY at shops for the surveys displayed on the dashboard when determining the "Current Period". Therefore a Dashboard with only Retail survey widgets would stay on January until a Feb Retail survey shop was finalized. Congratulations! You're a Dashboard Guru!
|
 \
\